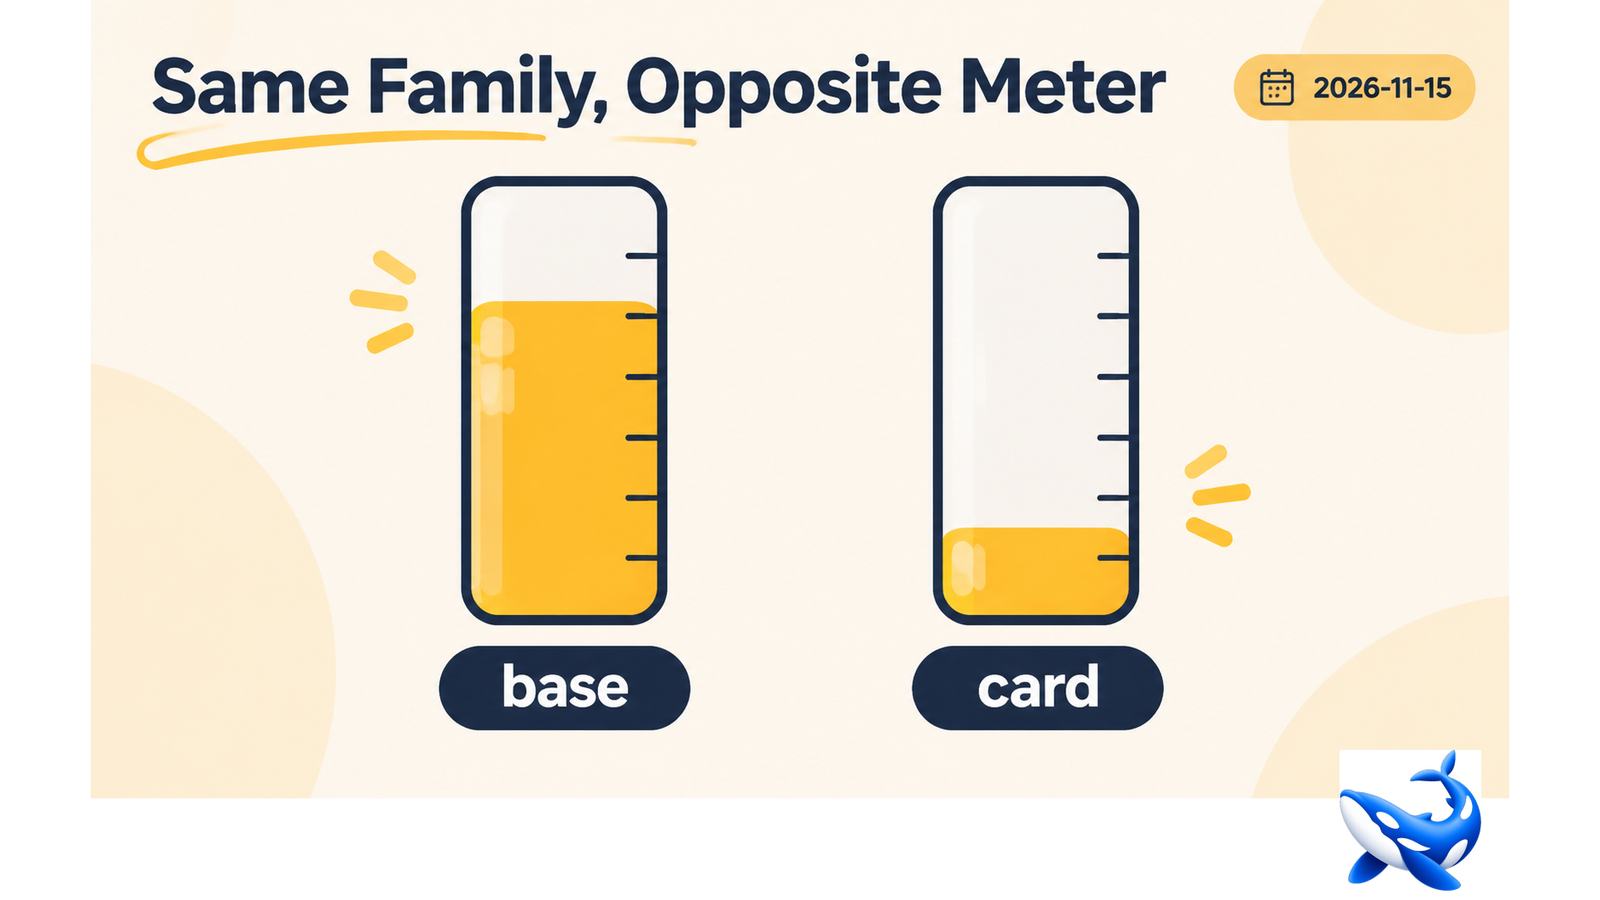

On OrcaRouter‘s cyber tier, the base MiniMax M3.1 Flash checkpoint returns an error on 20.401% of requests. The abliterated card built from it, MiniMax M3.1 Flash abliterated API, returns one on 0.272% [OURS].
A 75× improvement from an edit that only removed a behaviour direction is not a claim about model quality. It is a claim about the two endpoints, and reading it correctly tells you something useful about how to choose between a base checkpoint and its abliterated build.
The two cards, compared
| row | base | abliterated card |
| error rate | 20.401% | 0.272% |
| p50 first token | 3,046 ms | 1,695 ms |
| output speed | 54.7 tok/s | 129.9 tok/s |
| traffic 7d | 1.57B | 2.74B |
| context | 1,048,576 | 262,144 |
| output ceiling | 524,288 | 131,072 |
| input price | $0.15 | $0.80 |
| output price | $0.60 | $1.60 |
[OURS], seven-day windows ending 2026-11-15.
Read the serving rows and the card wins on all three. Read the size rows and the base wins on both. Read the price and the base is cheaper. That is the actual trade, and the error rate is the row that makes it look lopsided.
Why 20.4% on a base checkpoint is not surprising
A base checkpoint on a public catalogue is the default destination for everything: trial traffic, misconfigured clients, deprecated model ids, requests from keys without quota. It absorbs the errors that a gated card never sees.
The abliterated card is behind `locked: true`, `required_tier: sec-uncensored`, `required_band: offensive`. Only provisioned keys reach it. The gate that produces the 16.110% error rate on GLM 5.3 — where rejected attempts count as errors — is doing the opposite work here: it filters out the traffic that would fail.
So the two numbers measure different populations. The base is a public endpoint absorbing everything; the card is a private one serving a qualified audience.
That is not to say the card is not more reliable. It probably is, because a card that is being used deliberately for a job is used better than one being poked at. The point is that 75× is a comparison of audiences as much as of endpoints.
What the direction tells you
Three of the eight abliterated cards error less than their base; five error more [OURS].
• MiniMax: 0.272% against 20.401% — card much better
• MiMo: 0.938% against 60.595% — card much better
• Kimi: 1.306% against 6.545% — card better
• GLM 5.3 Flash: 0.705% against 4.437% — card better
• Qwen: 0.603% against 0.827% — roughly equal
• DeepSeek: 0.166% against 0.168% — identical
• Hy4: 0.714% against 1.047% — card slightly better
• GLM 5.3: 16.110% against 0.582% — card much worse
Six cards improve and two do not, and the two exceptions have explanations. DeepSeek’s pair is identical because both endpoints are well provisioned and neither gate rejects much. GLM 5.3’s is the gate effect, where a $3.00 card attracts fewer qualified callers.
So the direction is mostly “the gated card serves a better-behaved audience”, with one card where the gate itself is the resistance.
What it means for a purchase
The error row tells you what you will experience, not what the model is.
If you are considering the base checkpoint because it is cheaper — $0.15/$0.60 against $0.80/$1.60 — the 20.401% error rate is the number that should stop you. Retrying one call in five on a card that also runs at 54.7 tokens a second turns a cheap card into a slow and unreliable one.
If you are considering the abliterated card, the 0.272% is genuinely good news: at ten thousand calls a day it means 27 failures, which is low enough that retry logic is optional.
And if you are comparing across cards, the least useful thing to do is rank by error rate. The populations differ, and the row is a property of the audience as much as the endpoint.
The price of the improvement
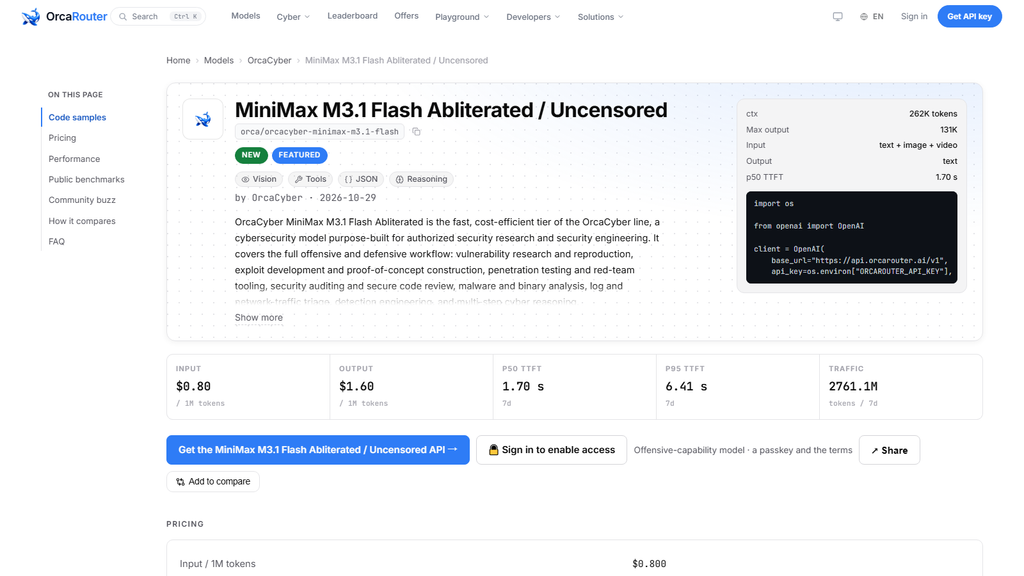
The card costs 5.33× the base on input and 2.67× on output, blended 3.81× [OURS].
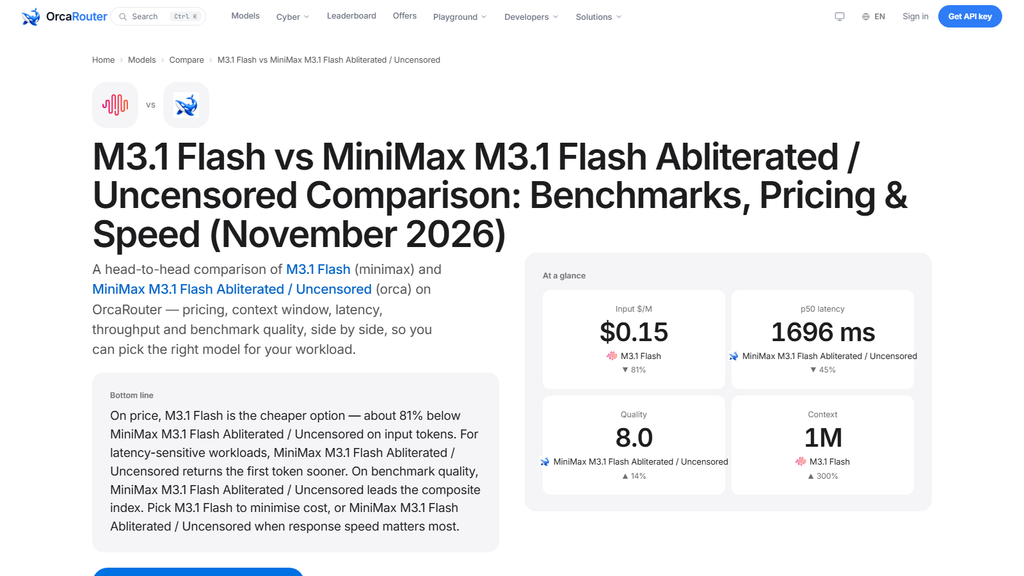
What that buys, in the rows above: 2.4× the throughput, a 44% lower median, and a 75× lower error rate. What it costs, besides money: three quarters of the context and three quarters of the output ceiling.
So the base checkpoint is the better card for long jobs and the worse card for reliable ones. That is an unusual split. On most of the tier the abliterated card is the smaller one and the base is the cleaner one; here the base is both larger and noisier.
A team that needs a million-token window has to accept the 20.401%, which in practice means staying on the abliterated card and chunking, or moving to another family entirely.
What 0.272% looks like in a week
Ten million requests a week at 0.272% is 27,200 failures.
That sounds like a lot and is not, because the number matters only in relation to what you can retry. At 54.7 tokens a second on a base checkpoint, a retry on a 1,500-token response costs 27 seconds. At 129.9 on the card, it costs 12. The card is a better card to fail on, which is a strange thing to write and an accurate one.
The practical threshold is: below about 1%, retries are cheap and invisible. Above about 10%, retries dominate the bill and the schedule. Between them, the retry policy is the design decision.
MiniMax’s card sits at 0.272% and its base at 20.401% — one on either side of that band. That is the clearest illustration of the threshold in the tier.
How to verify it on your own traffic
Two weeks of logging, and one experiment.
Log the status code of every call and the input token count. That gives you your own error rate by workload, which will differ from 0.272% because your prompts differ.
Take the failing calls and re-send them unchanged once. If the retry succeeds, the failure was transient. If it fails identically, it is structural and your prompts are hitting something the endpoint does not accept.
That experiment costs almost nothing at $0.80 per million and it distinguishes the two failure types, which the published rate cannot.
What the row does not tell you
Whether a card fits your job. It is a probability of failure per request and nothing else.
MiniMax’s 0.272% is the lowest among the cards that also deliver 129.9 tokens a second at a flat latency, and that combination is what makes it the tier’s best triage card. The error row is one third of that case, not the whole of it.
The short version
20.401% on the base against 0.272% on the card is a 75× improvement from an edit that changed no weights’ capabilities — it is a comparison of audiences, not of models.
Six of the eight abliterated cards error less than their base; GLM 5.3 is the exception and its gate explains it.
Use the row to describe what you will experience. Do not use it to rank cards against each other, and do not choose the base checkpoint on price without pricing the retries.
Sourcing note: error rates, prices, context windows, output ceilings, modalities, quality scores, latency, throughput and traffic are read from both cards’ public model data on 2026-11-15, with seven-day windows ending that day [OURS]. Blended multiples are our arithmetic at a 3:1 input-to-output mix. No benchmark rows are quoted.